Lithological and Structural Characterization of parts of the Lower Benue Trough, Southeast Nigeria, Using Radiometric and Aeromagnetic Data
| Received 06 Apr, 2023 |
Accepted 05 Jun, 2024 |
Published 06 Jun, 2024 |
Background and Objective: Geophysical signatures depend on lithology and structural properties. Evaluation and interpretation of radiometric and aeromagnetic data acquired over parts of Lower Benue Trough were done to characterize lithologies and structure. Materials and Methods: The airborne geophysical data was acquired along a series of NW-SE flight lines (perpendicular to regional trend) at 500 m line spacing and 80 m terrain altitude, with tie lines at about 2 km intervals and sampling interval of 1.0 s and 0.1 s for radiometric and aeromagnetic data, respectively. Data processing was done and key images of classified ternary map residual magnetic intensity and tilt derivatives maps were produced. Results: Qualitative analysis of produced maps integrated with geologic map of the study area showed that the outcrop of different rock formations presented peculiar magnetic and radiometric signatures/ratios such as Odukpani Formation and crystalline rocks (relatively high K and magnetic intensity), the Oban Massif facies (K = Th), Asu River group (K = Th = U around the central areas and K>U&Th towards the southwest), Ezeaku Formation (U>Th&K), Awgu and Nkporo (high U and K, respectively) and Mamu and Ajali Formations (relatively high Th and U=Th, respectively). Structural lineaments extracted from tilt derivative map showed fractures with major, intermediate and minor trends in the NE-SW, NW-SE and NNW-SSE, & E-W, respectively. Stress-strain relationships suggest that fractures with NNW-SSE, E-W; NE-SW and NW-SE trends represent pre-folding (pre-Santonian), syn-folding (Santonian) and post-folding (Post-Santonian) fracture systems, respectively. Conclusion: These results show that lithology and structural features can be mapped from geophysical data.
| Copyright © 2024 Okoli et al. This is an open-access article distributed under the Creative Commons Attribution License, which permits unrestricted use, distribution, and reproduction in any medium, provided the original work is properly cited. |
INTRODUCTION
The radiometric method, also known as the gamma-ray spectrometric method, is a useful geophysical tool applied in the estimation of the concentration of radioelements primarily of potassium (K), uranium (U) and thorium (Th) in near-surface rocks and soils, even though at least 20 naturally occurring elements are known to be radioactive1. This is achieved by detecting and measuring the gamma rays emitted from radioactive isotopes during radioactive decay. Radioactive surveys can be done using hand-held equipment in the case of ground radiometric surveys, or by special equipment mounted on platforms such as aircraft in the case of airborne radiometric surveys. All rocks and soils contain radioactive isotopes mainly of K, U and Th which emit gamma rays detected near the Earth’s surface as a result of their natural radioactive decay. Gamma rays are a composite band of EM waves of distinctive and characteristic frequency and energy which enables the identification of radioactive elements such as K, U and Th. The radiometric methods have diverse applications in geological mapping, mineral exploration, heat flow studies and environmental mapping1,2.
Aeromagnetic methods and surveys involve the acquisition of magnetic data usually over a relatively large area using specialized magnetometers mounted on airborne platforms2-4. Aeromagnetic surveys and data have applications such as in the estimation of sedimentary pile thickness over the basement rocks, mapping of structural features, exploration of mineral resources and the evaluation of geothermal energy potentials in a given locality, amongst others5-7.
The studies presented in this paper are aimed at characterizing the lithology and structural lineaments in the study area from integrated interpretations and evaluations of radiometric and aeromagnetic data.
MATERIALS AND METHODS
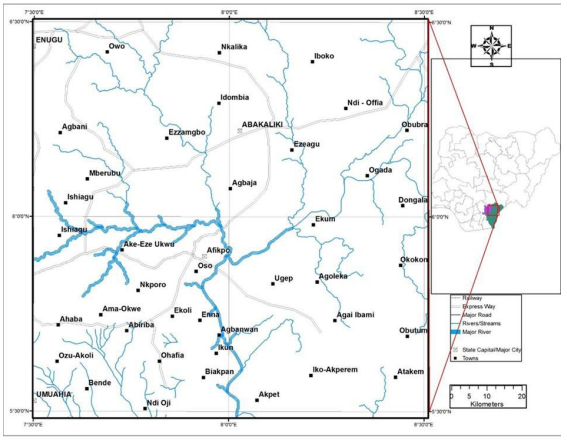
The study area lies within the Lower Benue Trough, Southeast Nigeria. It is bounded by Latitude 5°30'0"N to 6°30'0"N and Longitude 7°30'0"E to 8°30'0"E. Major towns in the study area include Afikpo, Abakilki, Nkalagu and Ugep.
The Benue Trough, which is divided into the Lower, Middle and Upper Benue Trough, is a NE-SW trending sedimentary basin that runs from the Gulf of Guinea in the South to the Chad Basin in the North. Previous studies suggest that the basin originated as a ‘pull-apart’ structure associated with the opening of the Atlantic Ocean and the extensive rifting of the Central and West African basement uplift which ended in Early Tertiary with the development of the Tertiary Niger Delta5-7. The sedimentary fill of the basin is characterized by magmatic activities as evidenced by the widespread occurrence of geologic structures and basic and intermediate intrusive and extrusive rocks8. This study was carried out from January to December, 2020.
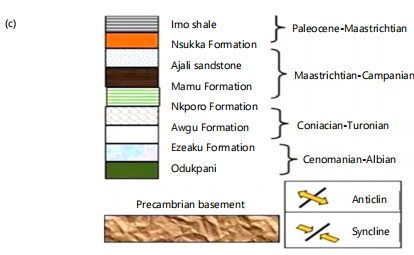
Sedimentation in the Lower Benue Trough started with the deposition of the marine Albian Asu River Group which comprises shales, limestones and sandstone of the Abakaliki Formation in the Abakaliki area; and the Mfamosing Limestone and Odukpani Formation in the Calabar Flank8 (Fig. 1). Overlying this is the marine Cenomanian-Turonian Eze-Aku Formation/Nkalagu Formation, the interfingering regressive sandstones of the Agala and Agbani Formations and the Awgu Shale. The Santonian (compressional) events shifted the major depositional centre westward, leading to the creation of the Anambra Basin. Post-Santonian deposition in the Lower Benue Trough (Anambra Basin) started with the Campanian-Maastrichtian marine and paralic shales of the Enugu and Nkporo Formations, which is overlaid by the coal-bearing Mamu Formation. The marginal-marine sandstones of the Ajali and Owelli Formations lie conformably on the Mamu Formation. This is succeeded by the Paleocene marine shales of the Nsukkaand Imo Formations and overlain by the Eocene tidal Ameki Group9,10.
|
Four (4) sheets each of aeromagnetic and radiometric data sets (Nkalagu sheet 302, Abakiliki sheet 303, Afikpo sheet 313 and Ugep sheet 314) covering a total area of about 12,000 km² were obtained from the Nigerian Geological Survey Agency (NGSA). The data sets were acquired between 2003 and 2010 by the Fugro Airborne Surveys on behalf of the Nigerian Government/NGSA during the nationwide aero-geophysical surveys. The survey was carried out along a series of NW-SE flight lines (perpendicular to regional trend) flown at 500 m line spacing and 80 m terrain altitude, with tie lines at about 2 km intervals. The data sets were collected at intervals of 1.0 s and 0.1 s, respectively.
The aeromagnetic data were pre-processed by the acquisition company (corrected for diurnal differences, aircraft heading, instrument variation, lag error between aircraft and the sensor and inconsistencies between flight lines and tie lines) and reduction done using the International Geomagnetic Reference Field IGRF-12. The Residual Magnetic Anomaly data were subjected to data enhancement operations of Reduction to Pole (RTP) which enhances magnetic features and enables better and well-constrained interpretations. Two-Dimensional Fast Fourier Transformation 2D-FFT of First Vertical Derivative (FVD) filtering which allows small and large amplitude responses to be more equally represented thereby enhancing linear features and First Horizontal Derivative (FHD) which significantly enhances mapping of linear geological structures and identification of geologic contacts and formations. The ratio of the first vertical derivative to the horizontal derivative was used to produce a Tilt Derivative Map which was used for lineament extraction.
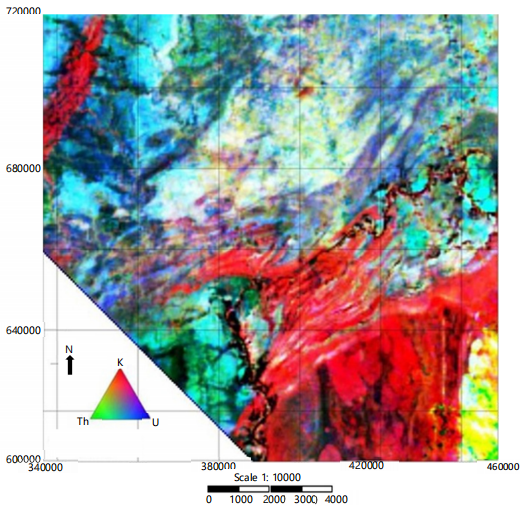
Statistical analysis: The pre-processed data were enhanced by performing micro-levelling on it to get rid of any apparent residual errors using the grid and image tool in Geosoft version 6.4.2 software. Total count images of the radioelements were generated using the mini-curvature gridding tool of the software to identify and evaluate K, Th and U concentration distributions at a 0.05 significance level. Radioelement composite and ratio maps were produced to present single displays of the three radioelement concentrations as well as the concentration of one radioelement over another in different regions. These maps infer the different lithologies due to the variations in concentration of the three radioelements and radioelement assemblages. Ternary maps were shaded with different colors representing the three radioelements. U, K and Th were represented with blue, red and green, respectively in the generated ternary map. Radioelement ratio image maps were also produced to improve resolution and differentiate lithology.
The major software used for the processing, enhancement and interpretation of the geophysical data sets is Geosoft (Oasis Montaj) version 6.4.2, Oriana version 4.02, Surfer 13 and Microsoft Excel 2013.
RESULTS
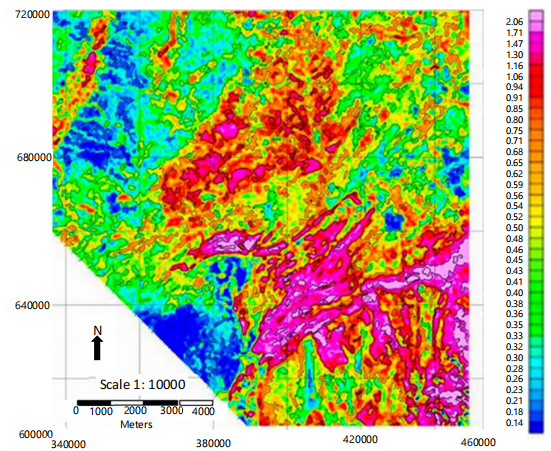
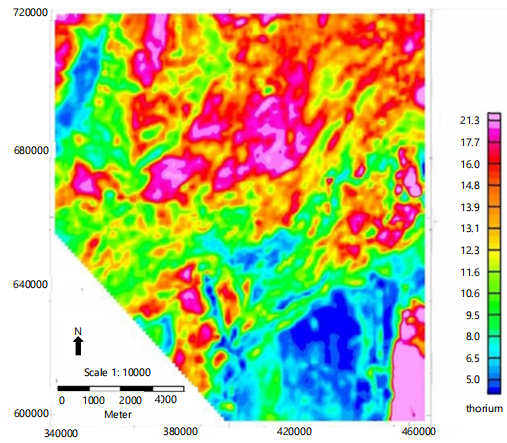
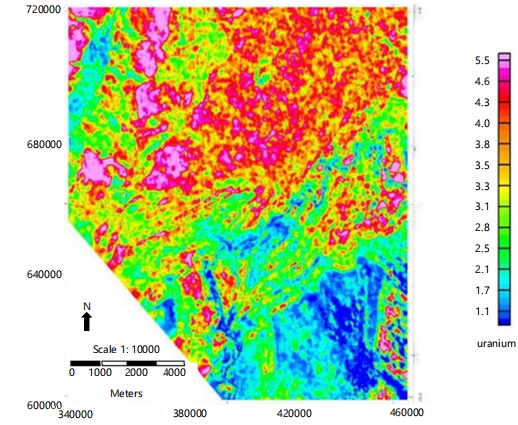
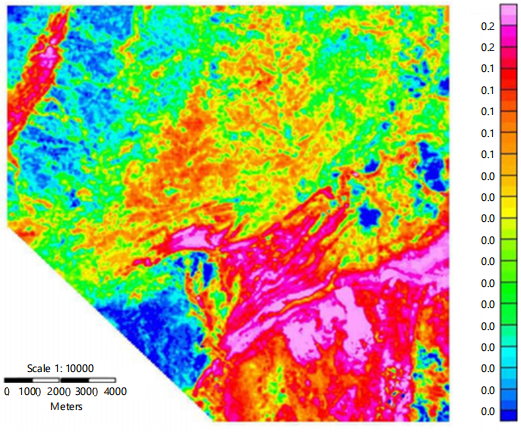
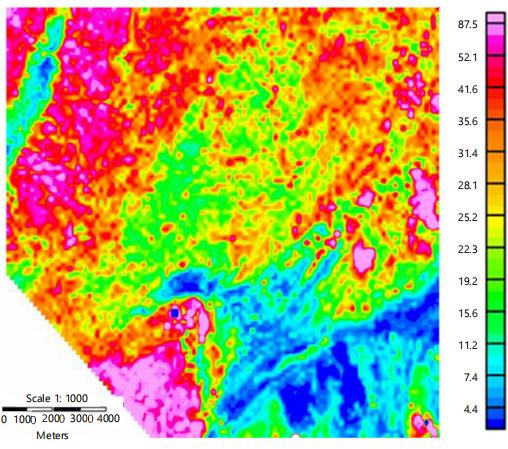
Radiometric data: To evaluate and determine the spatial distribution of the radio elements in the study area, the radiometric data were processed, analyzed and digitized to produce radioelement concentration maps of potassium (K), uranium (U) and thorium (Th). The maps are presented in Fig. 2-4. From the maps, it can be seen that a relatively high concentration counts of potassium, represented by bright red colour shades, occurs around the central, southeastern and northwestern parts of the study area (Fig. 2). A relatively high concentration count of thorium was recorded at the northern, central and southeastern parts of the study area (Fig. 3). Concentration counts for uranium gave relatively high values towards the northern parts of the study area in a similar trend to that of thorium but lower concentrations towards the south (Fig. 4). Radioelement ratio maps and ternary map, which provides better resolutions and lithology inferences were produced and presented in Fig. 5-7. Radioelement ratio map showed a relatively high potassium/thorium ratio at the southern and northwestern parts of the study area (Fig. 5) and a reverse distribution trend for the thorium/potassium ratio map which gave a relatively high ratio at the northern parts of the study area (Fig. 6). The ternary map (Fig. 7) gave a relatively high concentration count for potassium in the southeastern parts and varying ratios of k:Th:U in the central and northern parts of the study area. These varying radioelements concentration counts and ratios reflect the different lithology’s outcropping in the area.
|
|
|
|
|
|
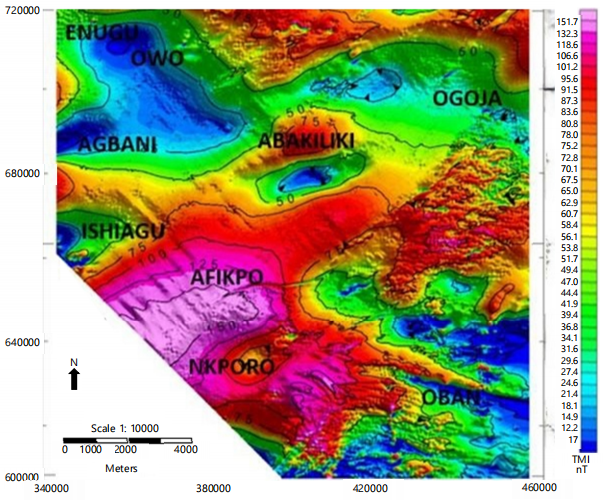
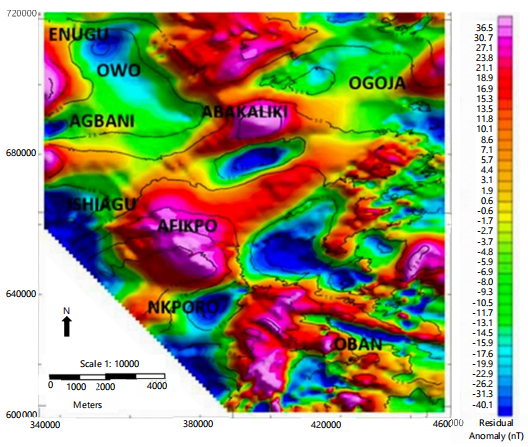
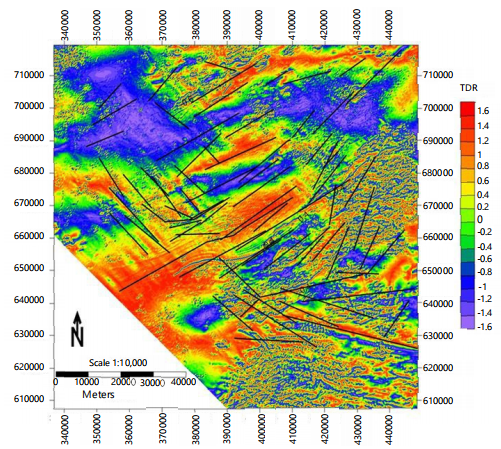
Aeromagnetic data: The Total Magnetic Intensity (TMI) map produced after data corrections and enhancement is presented in Fig. 8, while the residual magnetic anomaly map which emphasizes the magnetic effects of near-surface rocks and features is presented in Fig. 9. The residual magnetic anomaly map was obtained after the regional-residual separation. It can be seen from the residual magnetic anomaly map (Fig. 9) that areas around Abakiliki, Afikpo and Oban Massif are characterized by relatively high magnetic intensity, while areas around Enugu, Nkporo, Agbani are characterized by relatively low magnetic intensity. The Tilt Derivative map which is very useful for lineament extraction was produced and is presented in Fig.10. Lineament extraction was performed on the Tilt Derivation map and constrained by manually mapped linear features. The linear features were mapped manually based on variations in tone, texture, alignment, intensity of magnetic anomaly and other geomorphologic appearances in the map (Fig. 10).
The results of the analysis of the radiometric and aeromagnetic data were transformed into composite maps (Fig. 11) and plots (Fig. 12) to aid visualization, interpretation and appropriate inferences extraction.
|
DISCUSSION
The radiometric method has many applications and it is used primarily as a lithologic mapping tool. Lithologic and/or soil type changes are most times accompanied by changes in the concentrations of the radioelements5. Radiometric surveys determine concentrations of gamma radiations emitted by radioactive elements (K, Th and U) contained in minerals in the rocks1. Geological interpretation of radiometric data depends on the assumption that the absolute and relative concentrations of the radioelements (K, Th, U) and radioelement ratios vary considerably and manifestly with lithology. Different lithologies have their peculiar chemical composition and these compositions reflect on their radiometric signature. Different rock types with different compositions have different magnetic susceptibilities and hence when exposed to a magnetic field will become magnetized with different magnetic intensities. Generally, igneous and metamorphic rocks are characterized by high magnetic susceptibilities and intensities when compared with sedimentary rocks11. The magnetic intensity distributions recorded over an area can hence be used to characterize and differentiate major rock types especially when integrated with data from other geophysical methods.
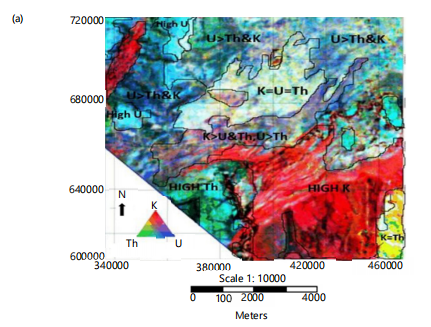
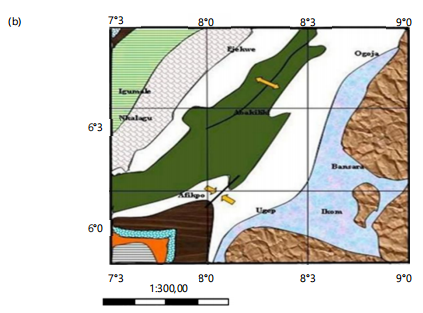
The ternary (radiometric) composite image map (Fig. 7) presents a single display of the three radioelement concentrations, with U, K and Th represented by blue, red and green, respectively. A classified ternary composite map juxtaposed with the geologic map of the study area is presented in Fig. 11.
|
Analysis and evaluation of the classified ternary map, indicate a relatively high concentration of K in the southeastern part of the study area correlates to the outcrops of the lithologies of the Oban Massif Basement Complex and its various facies and the Odukpani Formation of the Calabar flanks on the geologic map (Fig. 11) and compares well with results obtained in the Middle Benue Trough6. These areas recorded anomalous high positive magnetic intensity (Fig. 9) suggesting and lending credence to the occurrence of crystalline basement complex rocks which are characterized by relatively high magnetic intensity. The anomalous concentration ratio of K: Th (k=Th) towards the southern region (Fig. 11) correlates with the outcrop of granite-gneiss facies of the Oban Massif Basement Complex.
The granite-gneiss facies have a relatively lower magnetic susceptibility compared to the more basic facies of the Oban Massif and perhaps explains the relatively lower magnetic susceptibility recorded in parts of the southeastern areas which is generally correlated to the Oban Massif and is characterized by relatively high magnetic intensity (Fig. 9). Towards the southwestern parts of the ternary map, there are two triangular portions - an outer triangular portion characterized by relatively high concentrations of Th and on the geologic map correlates with the outcrop of the Mamu Formation which has shale, silt and sandstone facies; and an inner triangular portion characterized by relatively high concentration ration of U:Th (U=Th) and correlates with the outcrop of the Ajali Formation which has mainly sandstone facies with occasional clays and siltstones. The concentration ratio compares well with those of other workers6,7.
On the geologic map, both formations have triangular outcrop patterns that fit well and correlate with the geometric patterns expressed in the ternary map (Fig. 11). On the residual magnetic anomaly map, this same region with a similar triangular pattern also presented low magnetic intensity suggesting the presence of thick sedimentary rock pile around the region and greater depth to basement rocks. The Ajali Formation and the older underlying Mamu Formation are underlain by a number of sedimentary formations in that region, with the underlying basement rocks emplaced at relatively great depths. The Asu River Group has significant sandstone, limestone and shale facies outcrops at the core of the NE-SW trending anticlinorium (Fig. 11).
|
On the classified ternary map (Fig. 11), the Asu River Group presents an approximately equal concentration ratio of K:Th:U (K=Th=U) at the central parts of the study area. Towards the southwest, the Asu River Group presents a concentration ratio of K>U&Th, U>Th. These varied concentration ratio distributions observed in the Asu River Group may be due to the varied lithologic faces of the group which has significant thicknesses and representations. On the residual magnetic anomaly map, this area where the Asu River Group outcrops are characterized by a relatively NE-SW trending positive high magnetic intensity (Fig. 9). The trend, geometry and nature of the magnetic anomaly suggest that the depth to basement rocks in this region, which forms the core of the Abakaliki anticlinorium is relatively shallow. The Asu River Group is the oldest sedimentary unit in the Lower Benue Trough and lies unconformably on the Basement Complex, hence the inference of shallow depth to basement rocks as responsible for the relatively high magnetic intensity is credible. It also suggested that the high magnetic intensity in the region (where Asu River Group outcrops) especially towards the SW areas around Afikpo and environs is due to igneous intrusions and evidence of igneous activities as represented by a series of intermediate to basic intrusives belts trending NE-SW occurs in the area. Bordering Asu River Group outcrops on both sides are the younger and overlying Ezeaku Formation which has shale as its major facies (Fig. 11).
On the classified ternary map (Fig. 11) the Ezeaku Formation presents a radioelement concentration ratio of U>Th&K towards the NE and K>U & Th, U>Th towards the SW. Towards the NW of the geologic map and bordering the NW outcrop of the Ezeaku Formation, is the outcrop of younger and overlying Awgu Formation with shale as its main facies (Fig. 11).
|
|
The outcrop of the Awgu Formation trends NE-SW and parallel to the trend of the anticlinorium. On the classified ternary map, the Awgu Formation presents very a high concentration of U (Fig. 11). The Awgu Formation outcrop areas also presented relatively low magnetic intensity suggesting significant depths to basement rocks. On the classified ternary map is a linear strip of relatively high concentration of K towards the northwestern parts of the study area and bordering the Awgu Formation outcrop. On the geologic map, this linear strip correlates with the outcrop of Nkporo Formation which has relatively thick dark/grey shale and sandstone facies (Fig. 11).
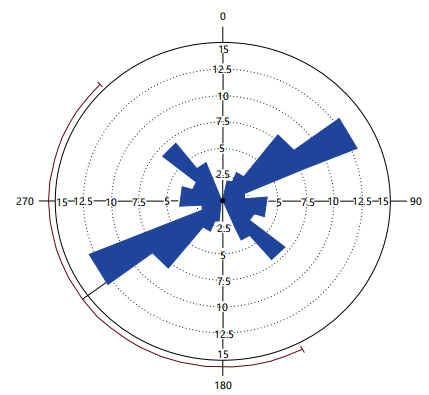
Structural features and lineaments can be determined from aeromagnetic data. Magnetic susceptibility contrast across and over a fracture zone occurs due to the oxidation of magnetic minerals in the fracture zone or infillings of fracture planes by mineral bodies whose magnetic susceptibility differs from those of the host rocks4. Structural lineaments extracted from the tilt derivative map (Fig. 10) showed that the area is significantly fractured with the major, intermediate and minor fracture trends in the NE-SW, NW-SE and NNW-SSE&E-W, respectively (Fig. 12). The mapped structural lineaments are related to the origin and tectonic development of the Lower Benue Trough.
Several workers agreed that the evolution and tectonic development of the Benue Trough are controlled by transcurrent faulting through an axial fault system, leading to the development of local transtensional and transpressional regimes, basins formation and basement horsts along releasing and restraining bends12,13. The Santonian tectonics is a major compressive event that affected the Lower Benue Trough giving rise to fracturing and magmatism and the development of the Abakaliki anticlinorium. All these tectonic events/regimes resulted in the formation of fractures (faults and joints), amongst other structures, which have trends and characteristics that are related to the stress regimes (magnitude and orientation of principal stresses) that were at play during their evolution and development. Based on stress/strain analysis, fracture orientations and field relationship, three fracture systems can be identified in the Lower Benue Trough: The Pre-folding (pre-Santonian), Syn-Folding (Santonian) and Post Folding (post-Santonian) fracture systems12. These three fracture systems have their characteristic stress-strain relationships and dominant fracture orientations.
An analysis of the orientations of the lineaments (fractures) extracted from the aeromagnetic data plotted on the rose diagram shows that the fractures have major, intermediate and minor trends in the NE-SW, NW-SE and NNW-SSE & E-W, respectively (Fig. 12). This collaborated well with the results of Igwe and Okonkwo12. The fractures with the minor trends (NNW-SSE, E-W) represent the pre-folding (pre-Santonian) fracture systems, while those with the major trends (NE-SW) and intermediate trends (NW-SE) represent the syn-folding (Santonian) and post-folding (post-Santonian) fracture systems, respectively. The syn-folding fracture systems trend, which represents the period of highest brittle deformation, is parallel to the Abakaliki anticlinorium and the intrusives belts in the study area trend in this same orientation, suggesting structure-controlled magmatism.
Analysis and interpretation of the concentration ratio distributions of radiometric data over the study area show that the different stratigraphic units with their characteristic lithologies can be identified and mapped without actual contact with the rock outcrops in the field. This can be applied in mapping areas that are inaccessible and challenging with credible results. Structural features were also characterized successfully from the magnetic intensity distribution map which can be applied in the tectonic history reconstruction of the study area.
CONCLUSION
Evaluation of results from the analysis of radiometric and aeromagnetic data showed that lithologic and structural inferences can be characterized and deduced from geophysical data. The different lithostratigraphic units in the study area presented distinctive and characteristic radiometric rations and magnetic intensities. Structural features were also interpreted from the geophysical data and their characteristics and geologic time significance were characterized.
SIGNIFICANCE STATEMENT
This research is aimed at characterizing the lithology and structural lineaments in parts of Southern Benue Trough from integrated interpretations and evaluations of radiometric and aeromagnetic data. This serves as a very useful alternative to conventional geological field mapping. Interpretation and results obtained showed that outcrops of the granite-gneiss facies, Asu River Group, Ezeaku, Awgu, Nkporo, Mamu and Ajali Formations have distinctive radiometric and magnetic signatures/motifs which can be used to map and characterize the formations. Structural lineaments extracted from the aeromagnetic data showed that the area is significantly fractured with the major, intermediate and minor fracture trends in the NE-SW, NW-SE and NNW-SSE & E-W directions, respectively. These structures are indicative of the orogenic evolution of the study area.
REFERENCES
- Telford, W.M., L.P. Geldart and R.E. Sheriff, 1990. Applied Geophysics. 2nd Edn., Cambridge University Press, Cambridge, pp: 158-160.
- Ukwuteyinor, U.B., A.G. Onwuemesi, I.I. Obiadi, E.P. Irumhe and S.O. Osaghae, 2021. Estimation of depth to basement, heat flow and hydrocarbon potentials from analysis of aeromagnetic data in some parts of Bida Basin. J. Basic Phys. Res., 10: 1-6.
- Irumhe, P.E., I.I. Obiadi, C.M. Obiadi, C.K. Ezenwaka and C.C. Mgbolu, 2019. Estimating sedimentary pile thickness, structural lineaments and heat flow in parts of North Central Nigeria from aeromagnetic data. Solid Earth Sci., 4: 92-101.
- Oghuma, A.A., I.I. Obiadi, C.M. Obiadi and C.N. Nwokeabia, 2017. Evaluation and structural interpretation of aeromagnetic anomalies over parts of monguno and environs, Northeastern Nigeria using 3-D euler deconvolution. Geosci. Res., 2: 226-235.
- Yusuf, A., L.H. San and I.A. Abir, 2021. A preliminary geothermal prospectivity mapping based on integrated GIS, remote-sensing, and geophysical techniques around Northeastern Nigeria. Sustainability, 13.
- Ngwaka, I.F., G.Z. Ugwu and G.E. Onyishi, 2023. Interpretation of aeroradiometric data of part of lower Benue trough of Nigeria for mineral deposits. Eur. J. Environ. Earth Sci., 4: 9-13.
- Ofoegbu, C.O., 1985. A review of the geology of the Benue Trough, Nigeria. J. Afr. Earth Sci. (1983), 3: 283-291.
- Ezim, E.O., I.I. Obiadi and M.I. Akaegbobi, 2017. The use of statistical grain-size method in analysing borehole and evaluating aquifer parameters. A case study of Ajali Sandstone formation, Southeastern Nigeria. Global J. Geol. Sci., 15: 77-92.
- Okoro, A.U., E.N. Onuigbo, E.O. Akpunonu and I.I. Obiadi, 2012. Lithofacies and pebble morphogenesis: Keys to paleoenvironmental interpretation of the nkporo formation, Afikpo Sub-Basin, Nigeria. J. Environ. Earth Sci., 2: 26-38.
- Oghuma, A.A., I.I. Obiadi and C.M. Obiadi, 2015. 2-D spectral analysis of aeromagnetic anomalies over parts of Monguno and Environs, Northeastern Nigeria. J. Earth Sci. Clim. Change, 6.
- Benkhelil, J., 1989. The origin and evolution of the Cretaceous Benue Trough (Nigeria). J. Afr. Earth Sci., 8: 251-282.
- Igwe, O. and I.A. Okonkwo, 2016. Application of paleostress analysis for the identification of potential instability precursors within the Benue Trough Nigeria. Geoenviron. Disasters, 3.
- Petters, S.W. and C.M. Ekweozor, 1982. Petroleum geology of benue trough and Southeastern Chad Basin, Nigeria. AAPG Bull., 66: 1141-1149.
How to Cite this paper?
APA-7 Style
Okoli,
E.O., Obiadi,
I.I., Obiadi,
C.M., Ezim,
O.E., Okeke,
G.C., Irumhe,
E.P., Mgbolu,
C.C., Odiegwu,
J.C. (2024). Lithological and Structural Characterization of parts of the Lower Benue Trough, Southeast Nigeria, Using Radiometric and Aeromagnetic Data. Asian Journal of Earth Sciences, 17(1), 1-14. https://doi.org/10.3923/ajes.2024.01.14
ACS Style
Okoli,
E.O.; Obiadi,
I.I.; Obiadi,
C.M.; Ezim,
O.E.; Okeke,
G.C.; Irumhe,
E.P.; Mgbolu,
C.C.; Odiegwu,
J.C. Lithological and Structural Characterization of parts of the Lower Benue Trough, Southeast Nigeria, Using Radiometric and Aeromagnetic Data. Asian J. Earth Sci 2024, 17, 1-14. https://doi.org/10.3923/ajes.2024.01.14
AMA Style
Okoli
EO, Obiadi
II, Obiadi
CM, Ezim
OE, Okeke
GC, Irumhe
EP, Mgbolu
CC, Odiegwu
JC. Lithological and Structural Characterization of parts of the Lower Benue Trough, Southeast Nigeria, Using Radiometric and Aeromagnetic Data. Asian Journal of Earth Sciences. 2024; 17(1): 1-14. https://doi.org/10.3923/ajes.2024.01.14
Chicago/Turabian Style
Okoli, Emmanuel, Odinaka, Izuchukwu Ignatius Obiadi, Chioma Maureen Obiadi, Onyeka Emmanuel Ezim, George Chizoba Okeke, Emmanuel Paul Irumhe, Charles Chinedu Mgbolu, and Johnpaul Chukwukelu Odiegwu.
2024. "Lithological and Structural Characterization of parts of the Lower Benue Trough, Southeast Nigeria, Using Radiometric and Aeromagnetic Data" Asian Journal of Earth Sciences 17, no. 1: 1-14. https://doi.org/10.3923/ajes.2024.01.14

This work is licensed under a Creative Commons Attribution 4.0 International License.


